FarCry inline request profiling & logging
August 16 2010, 8:05 PM
Profiling code and logging output for a request is painful. It usually involves checking the IP address or URL variable to make sure only a developer sees it, and has to be outputed using cfdump/cfoutput followed by an abort. Blair has added support for profile=1. Just tack it onto the end of your URL when you are developing. (You'll need to wait for 6.0.6 https://farcry.jira.com/browse/FC-2330 or be running from the p600 maintenance branch)
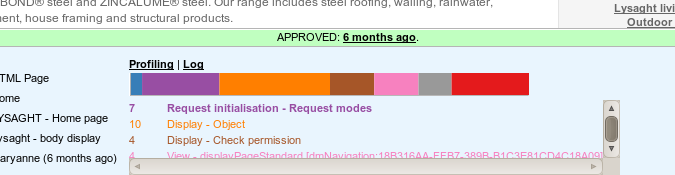
 If the "tray menu" is showing (ie. you have logged into the webtop earlier with admin permmissions), this mode starts tracking calls to application.fapi.addProfilePoint(section,label) and application.fapi.addRequestLog(text). The profile functionality is a little bit primitive at this stage, but it's enough to show relative times between points. FarCry Core has a few points already in place to track request initialisation and view execution.
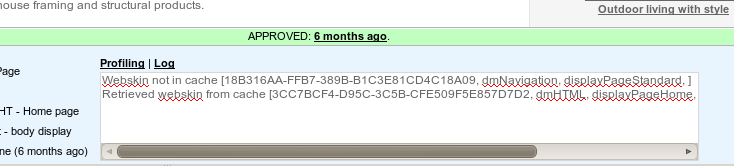
 The logging is also simple; a list of strings. Timestamps are recorded but not outputed. Core has logging for cache hits and misses.
 Enjoy!